We are excited to announce that Amper Technologies has joined forces with ECI Software Solutions, a leader in AI-powered, cloud-based business management solutions.  Read More →

production monitoring & Intelligence

FIND hidden capacity. fix inefficiencies.

Stop operating in the dark. See every machine, operator, and job in real time to find the waste that hurts performance and scale the wins that drive growth.

HMS text logo in black with modern, bold font.
Toyota logo above a black rectangle with white text reading MATERIAL HANDLING.
Boeing wordmark in black text on a transparent background.
Black stylized text reading 'Anderson Gleason'.
MODINE logo.
IDEX Corporation logo with bold stylized letters and an arrow integrated in the letter E.
why amper

See Your Whole Plant in Real Time

Flowchart with three stages: Unify with Machines, Jobs/ERP, and People; Analyze with OEE timelines and insights showing 65% current and 74% last month with a 12.1% decrease; Act with Issue Management, Operator Interface, Machine Maintenance, and Smart Scheduling.
AUTOMATED DATA COLLECTION

See Real-Time Data With Zero Interruption

Amper replaces slow, manual tracking by automatically unifying data from every machine, job, and operator, delivering the real-time source of truth your team needs to stay aligned and focus on what matters.

Yellow check mark icon.
Capture machine data automatically with IoT sensors that track uptime, downtime, and cycle counts in real time.
Yellow check mark icon.
Add critical business context with pre-built ERP and MES integrations that link jobs, parts, and production standards to machine signals.
Yellow check mark icon.
Capture human insights with a simple, touchscreen interface to label downtime, scrap, and setups.
LEARN MORE
Text logo reading 'Rough Country' in bold red stylized letters.

+50%

PRODUCTIVITY INCREASE
within 30 days
READ FULL STORY

“Now, we know where we stand every hour. If we’re off track, we fix it. If we’re hitting goals, we celebrate it.”

Ryan Chase
Director of Manufacturing Ops
Front view of a red Toyota truck driving through a forested area with headlights on.

all plans include:

Yellow line art of two electrical plugs facing each other without connection.
ERP integrations

to connect production data from your business systems 
with reality

Yellow gear icon symbolizing settings or mechanical configuration.
universal Hardware

for utilization tracking
and real-time cycle counting

Yellow pie chart icon with three distinct slices on a white background.
oee & downtime

to expose inefficiencies and pinpoint downtime causes for faster problem-solving

Yellow clock icon showing time at approximately 3:00.
realtime alerts
& dashboards

that surface live production metrics for quicker, more confident decisions

Four yellow vertical bars of increasing height forming a simple bar chart icon.
CUSTOM REPORTS

uncover the long-term patterns and bottlenecks limiting your capacity

DATA-DRIVEN DECISIONS

Power a Culture of Continuous Improvement

Amper gives your team real-time insights to fix issues fast, solve problems together, and celebrate wins as they happen. It powers a culture built on small wins that drive lasting growth.

Yellow check mark icon.
Empower frontline workers with clear targets and instant feedback to hit shift targets, reinforcing accountability and ownership.
Yellow check mark icon.
Alert supervisors to bottlenecks in real time and prevent future failures to keep production on track.
Yellow check mark icon.
Empower leaders with real-time insight to focus people, jobs, and capital where it drives the highest return.
EXPLORE FEATURES
A technician in a blue uniform holding a tablet with an alert popup showing Doosan #1 downtime detected, 100 out of 143 good parts, 82% utilization, and 71.6% OEE, and a button to call maintenance.
Aurora Material Solutions logo with stylized blue text and abstract wave design.

75%

reduction in rework
READ FULL STORY

“We realized that some products were dragging us down. They weren’t worth the time and resources we were putting into them.  It’s a game-changer to make decisions based on data instead of assumptions.”

Flavio Rawicz
Aurora’s Plant Manager
Tablet screen showing a manufacturing dashboard for Line 2 Extruder with job details, parts count, and performance metrics.
OPTIMIZE plant PERFORMANCE

Keep Every Shift on Track

Our integrated modules connect real-time data to your team’s daily workflows, creating a powerful flywheel for continuous improvement.

OPERATOR PRODUCTION INTERFACE

Drive Focus & Efficiency at Every Machine

Amper provides operators with a live view of job progress and the tools to manage it, giving them everything they need to manage their day, hit targets, and hand over shifts seamlessly.

Yellow check mark icon.
Capture root causes instantly with automatic prompts that help operators quickly categorize downtime.
Yellow check mark icon.
Track scrap in real-time to catch yield issues early and update production forecasts automatically.
Yellow check mark icon.
Reduce downtime & increase utilization by managing support tickets, job setups, and shift handovers directly from one screen.
SEE IT IN ACTION
Manufacturing dashboard for DOOSAN #1 showing goal and part numbers, current work stats with 15 good parts and 5 scrap, cycle time of 238 seconds, and a goal forecast with 35.6 hours remaining and target end date of 05/23/24.
DYNAMIC PRODUCTION SCHEDULING

Stop guesswork. Plan with real-time capacity.

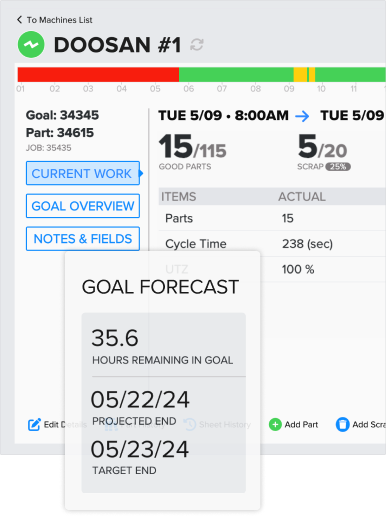
Amper connects ERP work orders with live shop floor data to create a dynamic plan that automatically adapts to real-time changes to meet customer demands on time, every time.

Yellow check mark icon.
Auto-generate accurate forecasts for job completion times using real-time performance data, not estimates.
Yellow check mark icon.
Easily adjust schedules with drag-and-drop functionality to accommodate rush jobs or unplanned downtime.
Yellow check mark icon.
Keep your team aligned with flexible Kanban and job-level views that show the plan clearly.
SEE IT IN ACTION
Dashboard showing scheduled jobs for machines Okuma #1, #2, and #3 with job statuses, due dates, progress bars, and operator names.
AUTOMATED ISSUE MANAGEMENT

One System to Capture, Track & Resolve Any Issue

Amper breaks down silos by connecting machines, teams, and workflows in a single system to capture, assign, and track every issue so you reduce downtime and maximize output.


Yellow check mark icon.
Minimize response time with tickets auto-created from live machine data or logged by operators in seconds.
Yellow check mark icon.
Accelerate resolution with automatic routing and alerts, team assignments, and unified communications.
Yellow check mark icon.
Prevent recurring issues by capturing root cause and corrective actions, tracking repeats, and verifying fixes.
SEE IT IN ACTION
Ticket management table showing IDs, assets, statuses including New, In Progress, Accepted, reason codes like Calibration needed and Equipment Failure, with some entries marked by blue comment icons.
MAINTENANCE MANAGEMENT

Switch from Reactive Repairs to Proactive Care

Amper uses real-time machine data to trigger maintenance before it slows production, helping you extend asset life and prevent unplanned downtime.

Yellow check mark icon.
Automate maintenance requests based on actual runtime hours or cycle counts, not just dates.
Yellow check mark icon.
Capture work orders fast from machine-mounted operator interfaces.
Yellow check mark icon.
Diagnose failures faster using a complete digital history of machine health.
Yellow check mark icon.
Track work order status on digital scoreboards to monitor repair status in real-time.
SEE IT IN ACTION
Maintenance dashboard showing status bars and details for Change Tooling, Filter change, and Oil change tasks across various machine assets with last completed dates, due dates, and status indicators including OK, At Risk, and Needs Ticket.

Find What Works. Fix What’s Broken.

WITH AMPER